
Manufacturing Energy and Emissions Management
Measure energy and emissions per line, per shift and per unit produced, so reduction targets are pursued against evidence rather than against the monthly utility invoice.
Solution Overview
The Challenge
Most plants understand energy consumption at the level of the site meter and the monthly invoice, which is far too coarse to act on.
- 1Consumption understood at site meter level, far too coarse to act on
- 2No visibility of which line, shift or product drives a consumption spike
- 3Compressed air leaks and idle equipment persisting for years because they are invisible
Our Approach
CloudGate meters at line and major-equipment level with telemetry streaming into Fabric Real-Time Intelligence, normalizing consumption per unit produced so comparisons across lines, shifts and products are meaningful.
- Sub-metering at line and major-equipment level rather than site level only
- Consumption normalized per unit produced for meaningful cross-line comparison
- Anomaly detection on leaks, idle draw and unexplained out-of-hours consumption
Typical Outcomes
Typical outcomes for this solution pattern, not the results of a named client engagement.
Technologies Used
More Success Stories
View all case studies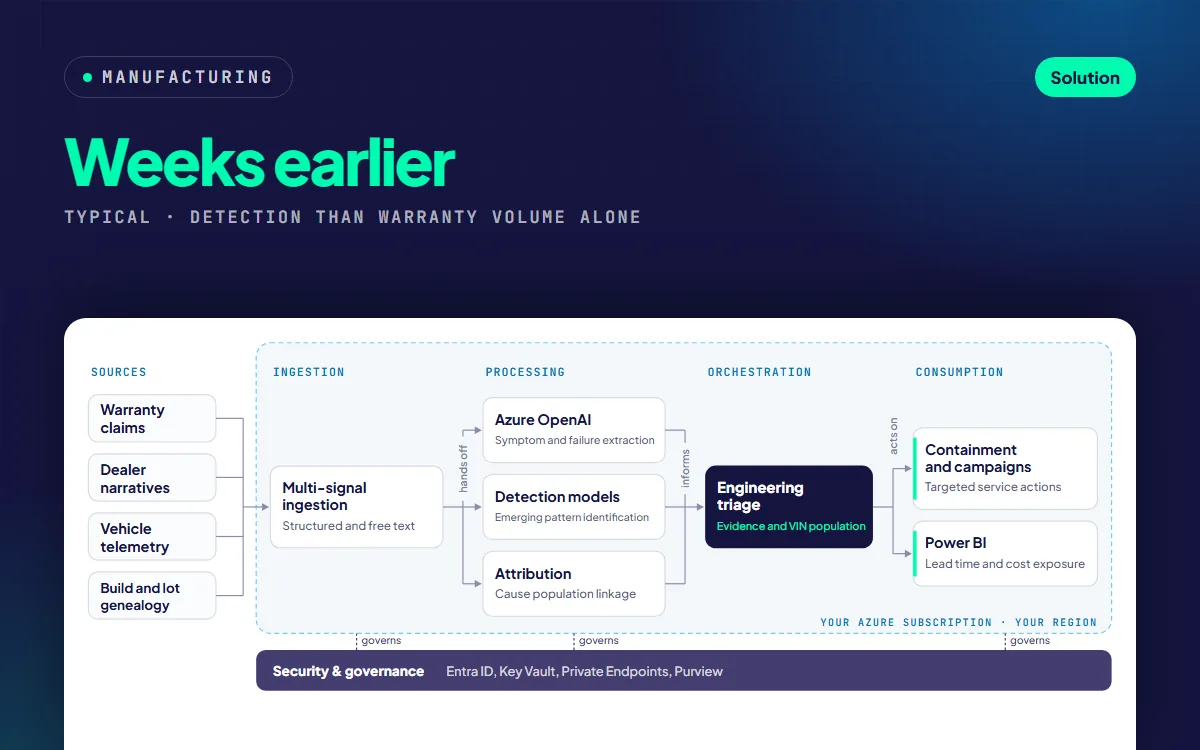
Vehicle Quality Early Warning from Warranty and Telemetry
Detect emerging quality issues weeks earlier by combining warranty claims, dealer narratives and vehicle telemetry, and scope the affected population precisely enough to contain it.
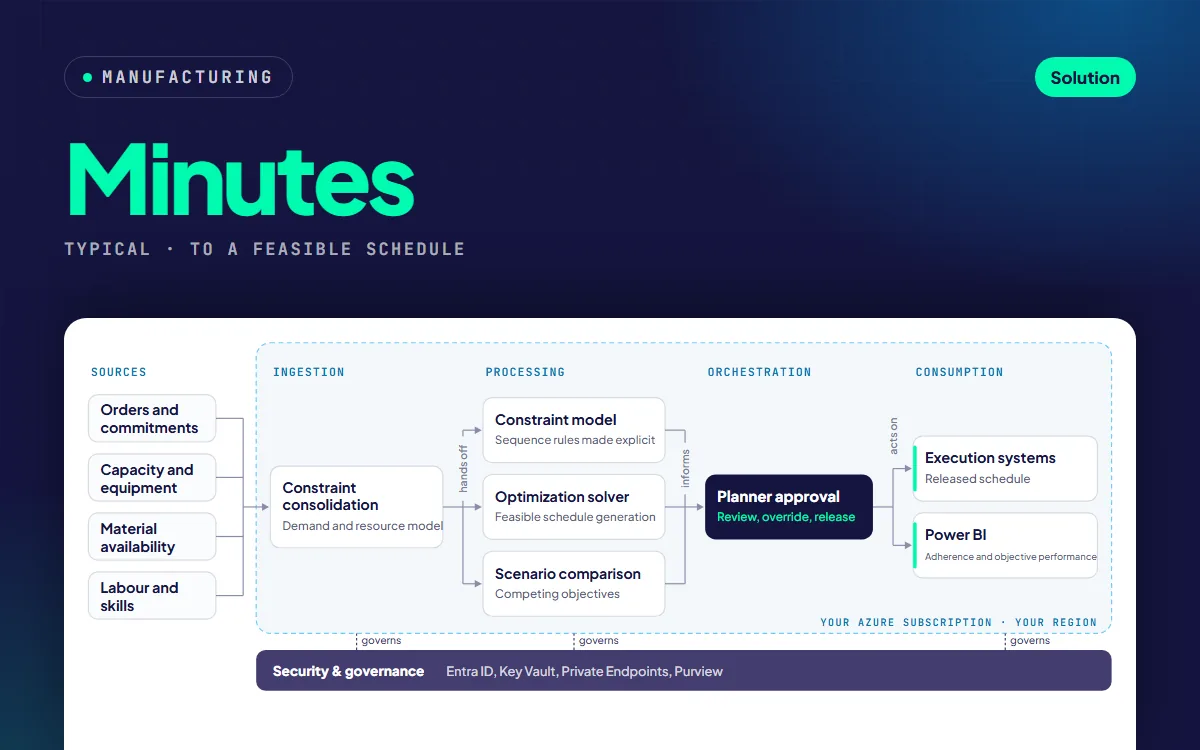
Production Scheduling and Sequencing Optimization
Generate feasible production schedules against real constraints in minutes, and let planners compare objectives before committing rather than defending a plan built in a spreadsheet.
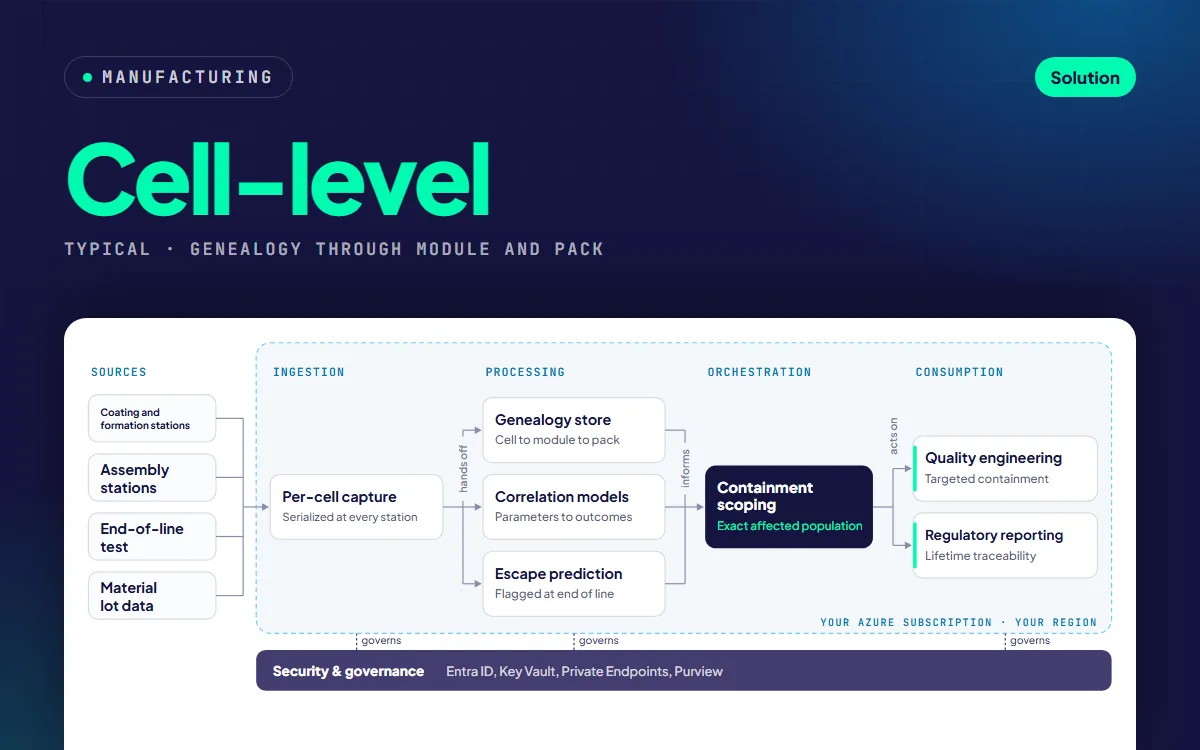
EV Battery Cell Quality and Full Genealogy Traceability
Capture cell-level process and test data with full genealogy from cell to module to pack, so a suspect condition is contained to the exact units affected rather than an entire build period.